SQL
Complex queries, JOINs, CTEs, window functions, aggregations, data marts and data validation.
Data & BI Analyst
I work with data to find patterns, explain changes in metrics and support business decisions. I use SQL, Python and BI tools for analysis, automation and reporting.
Moscow · On-site, hybrid or remote

The tools I have used and the tasks I used them for. Follow the links to read the related case studies.
Complex queries, JOINs, CTEs, window functions, aggregations, data marts and data validation.
Data processing and transformation, exploratory analysis, recurring calculations and API integrations.
Sales, customers, funnels, trends, conversion, retention and customer segments. Investigating changes and patterns in data.
Ad-hoc requests, recurring reports, hypothesis testing, identifying anomalies and preparing business insights.
Data models, metric calculations, interactive dashboards and visual communication of findings.
Warehouses, data marts, Stage / ODS / Core layers and DAGs for recurring data loads.
01 / BI & DATA
Data ingestion and processing, DWH, data marts, a semantic model and Power BI reports
The project involved a second outsourced analyst. An external developer implemented the 1C API changes based on my specifications
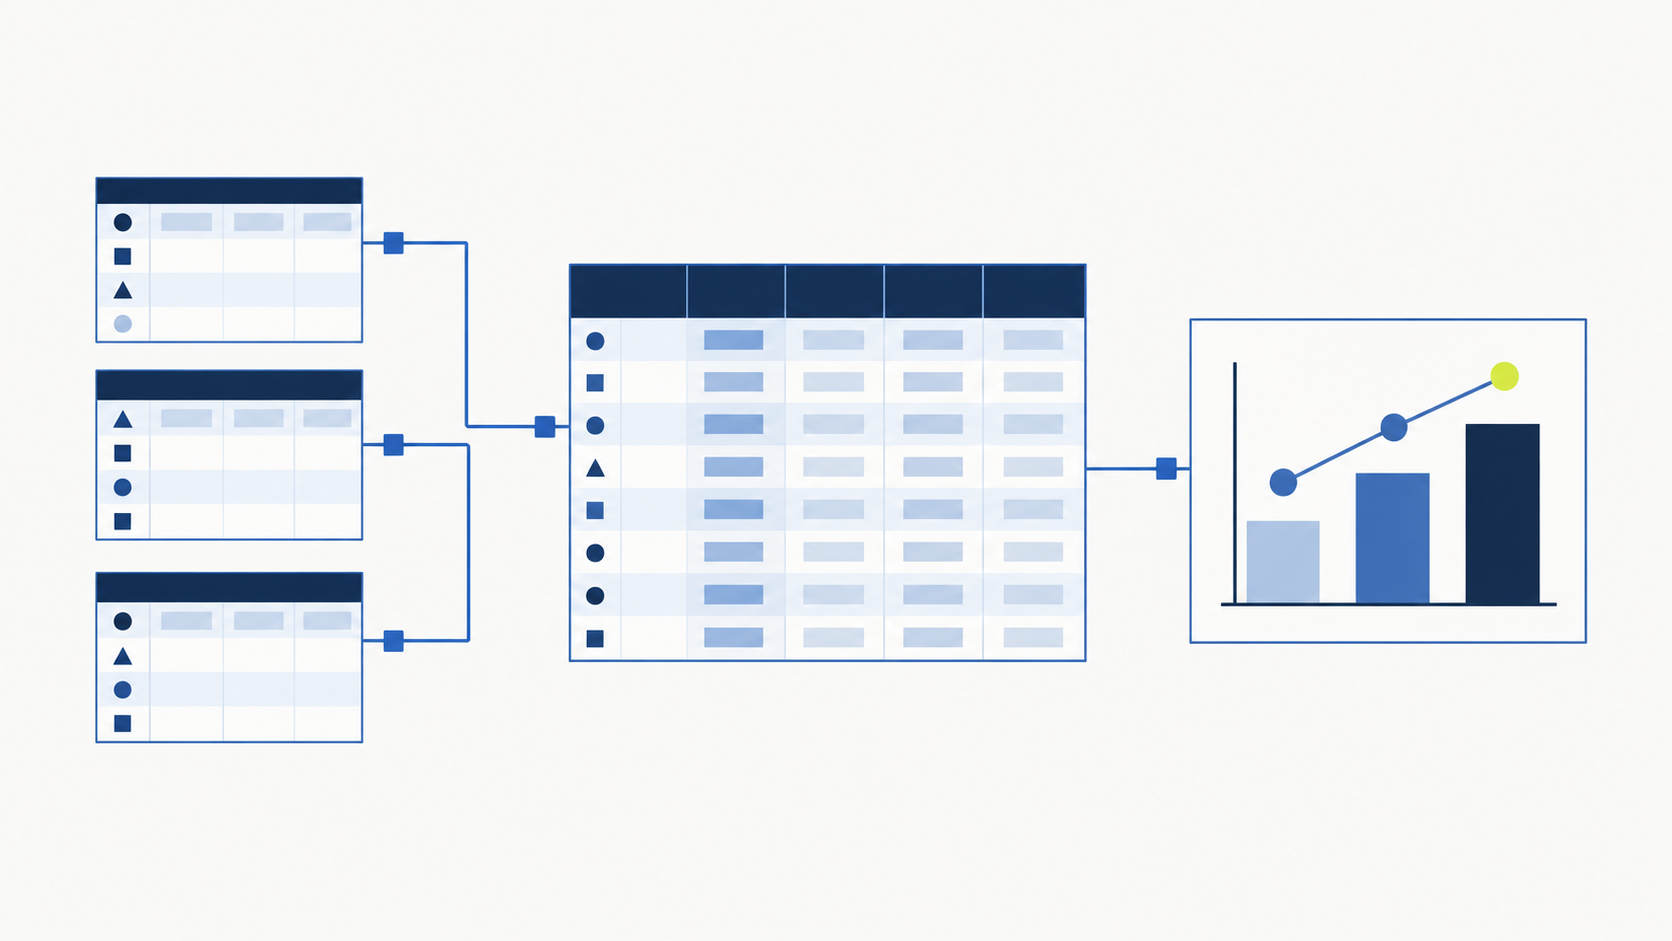
I initiated and presented the analytics project to management. I implemented key stages: DWH modelling, DAGs, processing layers and data marts, a metrics model and Power BI dashboards
Data was stored in several systems: 1C, CRM, advertising platforms and Google Sheets. Managers manually exported and combined data in spreadsheets to prepare reports. There was no unified data structure or automated reporting
A unified analytics system with a central data warehouse was created. Data from 1C, CRM and other sources is automatically loaded, processed and checked, then used to build data marts and a Power BI model. Reports refresh automatically and are used by different departments
Sales were analysed through several 1C reports: data was exported, transferred to Google Sheets and reconciled manually.
Marketing data was fragmented. Leads entered Bitrix24, managers entered them separately into 1C, and CRM, advertising and 1C data were combined in Excel on request. Reports took time to prepare, and new analytical cuts required more manual work
Build a unified analytics system for marketing, sales and management: connect sources, establish end-to-end customer journey analytics, organise data processing and provide teams with ready-to-use BI reports.
Incremental API ingestion, DWH processing and BI reporting
Orchestrated with Airflow DAGs
1C, CRM, Bitrix24 and advertising systems
Initial data ingestion
Operational processing layer
Integrated data
Business subject areas
Relationships and business logic
Power BI · Yandex DataLens
Data marts and reports tailored to each department
Leads, sources, CPL and conversions
Lead handling, meeting scheduling and manager performance
Meetings, calls and sales
Consolidated management reports
Table and field names are generalised: the diagram shows the main relationships, not the full schema.
CRM, 1C ERP and advertising systems used by the business
API-based ingestion and workflow orchestration with DAGs
The initial layer of ingested data
The operational data-processing layer
The central layer of linked data for analysis
Prepared datasets for analytical questions and reports
Fact and dimension relationships and metric calculations
Dashboards for the customer funnel, customer events and financial performance
 02
Customer and sales data analysis
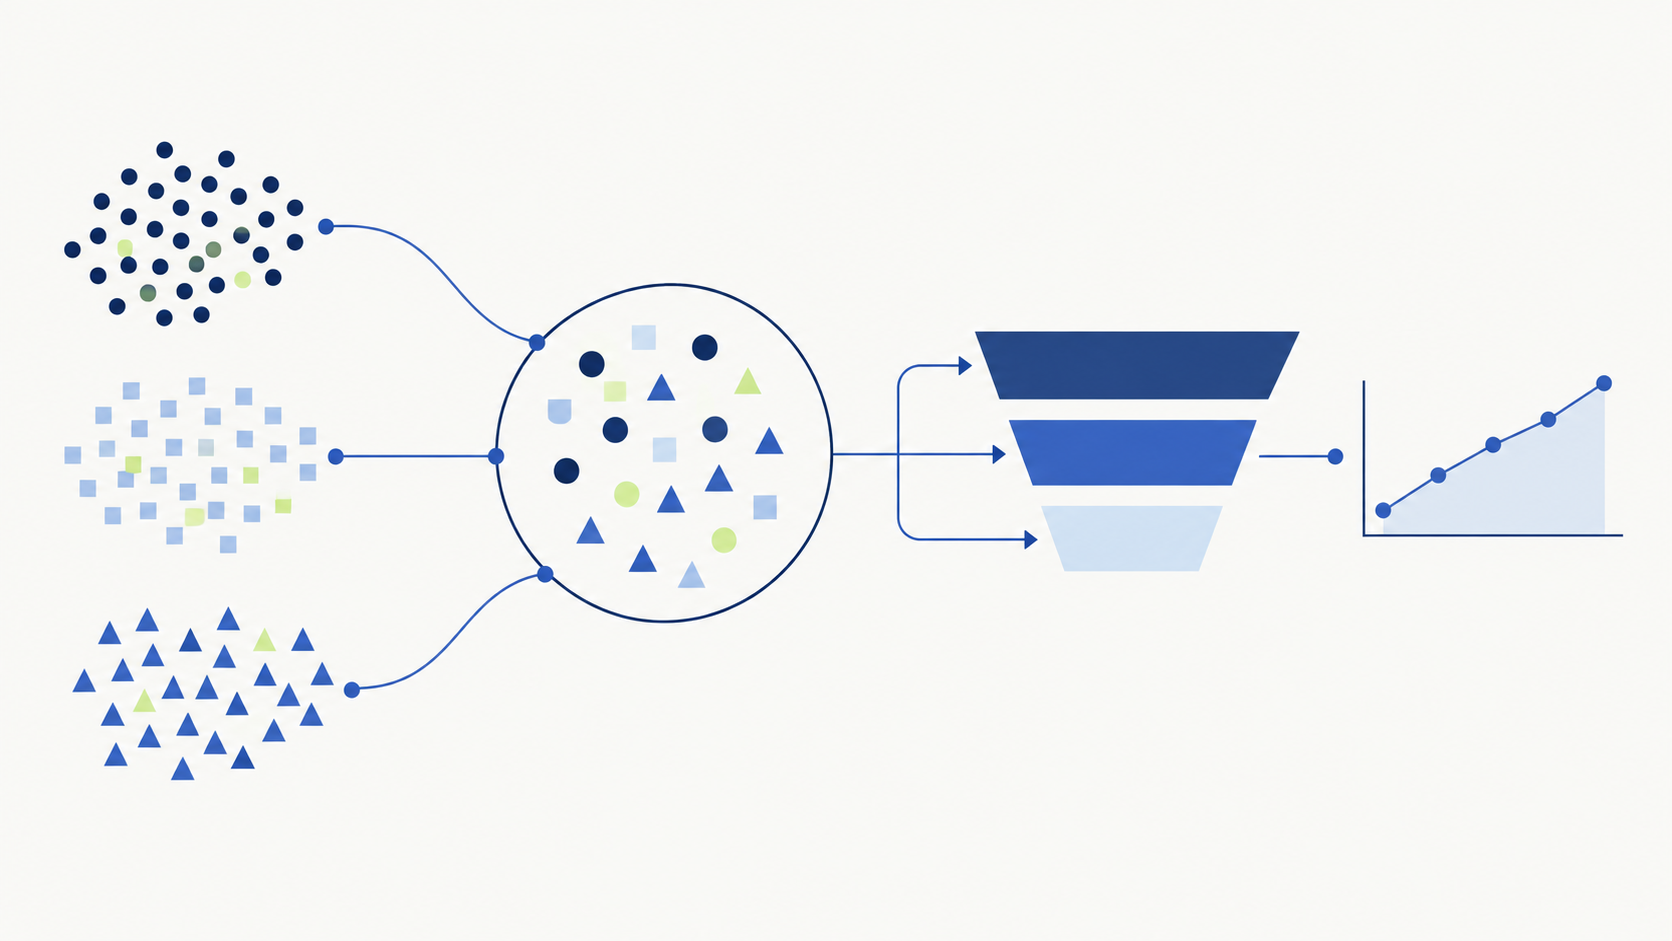
Sales trends, RFM analysis and conversion across the customer funnel
02
Customer and sales data analysis
Sales trends, RFM analysis and conversion across the customer funnel
Analysed sales, the customer funnel, repeat purchases, cohorts and RFM segments.
Regular reporting and business questions led to analytical tasks: why revenue changes, which customers return, where enquiries drop out of the funnel, how branch performance changes, which channels attract more valuable customers and how purchasing behaviour differs across segments.
Answer business questions using data: prepare datasets, calculate metrics, compare segments and periods, investigate changes and turn the findings into clear business insights.
Analysed transactions and purchasing behaviour: repeat purchases, order frequency, average order value and customer lifecycles. Performed RFM and cohort analysis, calculated LTV and compared acquisition channels.
Customer segmentation informed further communication and retention. Work with customer segments helped increase the share of repeat purchases by approximately 20%.
Analysed the patient funnel, calculated conversions and investigated drop-offs.
Worked with repeat visits, average transaction value, cohorts and LTV. Compared acquisition channels and customer metrics for marketing and service teams.
Analysed orders, seasonality, geography and demand mix. Examined delivery times, vehicle utilisation, deliveries per vehicle and downtime.
Used findings for recurring BI reporting and identifying operational deviations.
 03
Marketing reporting automation
Daily lead monitoring and weekly summaries in Bitrix24
03
Marketing reporting automation
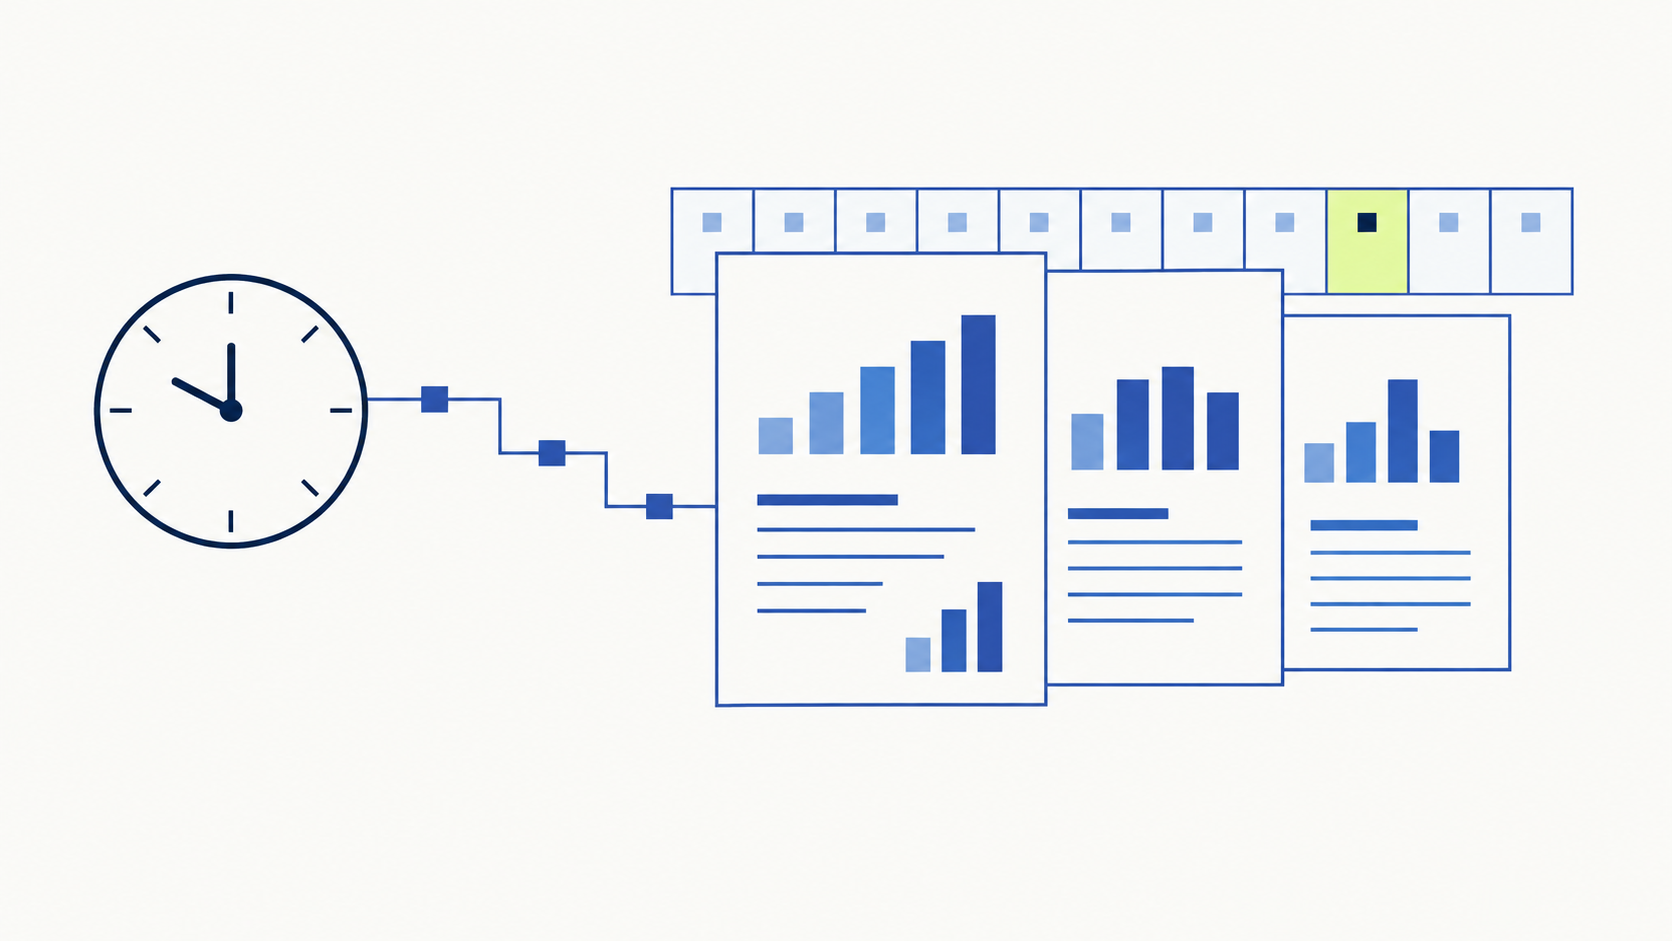
Daily lead monitoring and weekly summaries in Bitrix24 Built a bot and introduced it into marketing workflows to deliver daily lead monitoring and weekly metrics for marketing operations meetings.
The marketing manager and team needed regular performance metrics in their everyday work channel: Bitrix24.
Automate preparing and sending reports to the marketing chat in Bitrix24.
The daily summary reports new lead counts and their distribution by source and city.
The weekly summary compares the previous two complete weeks: leads, booking and purchase conversion, and CPL based on allocated spend. It highlights branches that need attention and includes detailed Excel calculations and methodology.
 04
AI assistant for marketing task creation
An AI bot that clarifies marketing requests and creates tasks in Bitrix24
04
AI assistant for marketing task creation
An AI bot that clarifies marketing requests and creates tasks in Bitrix24
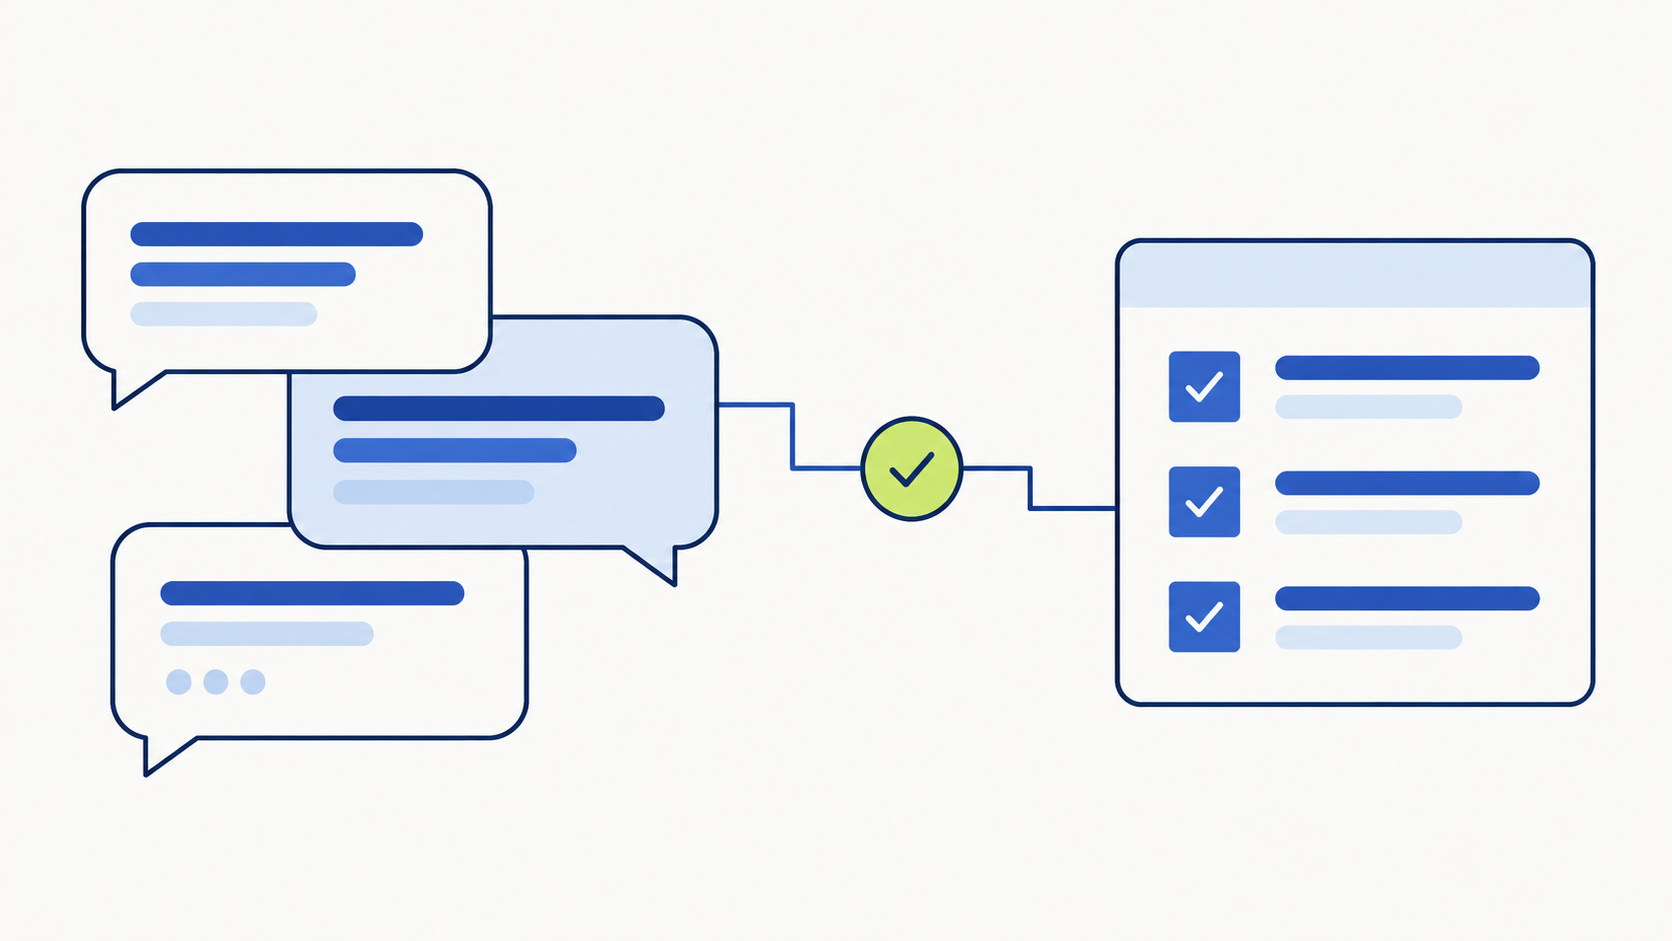
Built a Python bot that clarifies employee requests for the marketing team, suggests an assignee and creates a Bitrix24 task after confirmation. Tested and introduced it into marketing workflows.
Employees needed a clear way to submit requests to marketing. The assistant helped clarify the work required, the expected result and the appropriate assignee.
Create a workflow from an employee’s initial message to a Bitrix24 task, with user confirmation before task creation.
An employee sends a request to the bot in Bitrix24. The bot asks follow-up questions, drafts a task based on company and marketing team rules, suggests an assignee and creates the task once the user confirms.
The bot application and database are hosted on a server.
The AI is accessed through API requests.
 05
Advertising campaign analysis
Marketing analytics for a monthly budget of over RUB 4 million
05
Advertising campaign analysis
Marketing analytics for a monthly budget of over RUB 4 million
Analysed Yandex Direct campaign performance with monthly budgets exceeding RUB 4 million.
Use advertising platform and Yandex Metrica data to evaluate performance and recommend campaign improvements.
Combined advertising statistics with lead data and subsequent customer funnel stages.
Made analytics part of ongoing campaign management, rather than a separate end-of-period report.
April–June 2026 · all branches
| By source | Leads | Customers with a booking | Customers with a meeting | Buyers | Revenue | Acquisition spend | Lead-to-purchase rate | Blended CPL |
|---|---|---|---|---|---|---|---|---|
| Outdoor advertising | 1,389 | 874 | 593 | 191 | RUB 11,424,764 | RUB 240,623 | 13.8% | RUB 173 |
| Radio | 1,019 | 640 | 432 | 134 | RUB 8,126,726 | RUB 176,458 | 13.2% | RUB 173 |
| Partner network | 5,036 | 3,527 | 2,394 | 875 | RUB 49,780,457 | RUB 356,997 | 17.4% | RUB 71 |
| Yandex Direct | 3,182 | 1,717 | 1,160 | 324 | RUB 18,918,457 | RUB 5,218,292 | 10.2% | RUB 1,640 |
| VK Ads | 3,824 | 1,641 | 1,097 | 239 | RUB 14,838,661 | RUB 4,731,026 | 6.3% | RUB 1,237 |
| TV | 2,223 | 1,407 | 953 | 302 | RUB 18,288,775 | RUB 384,997 | 13.6% | RUB 173 |
| Total | 16,673 | 9,806 | 6,629 | 2,065 | RUB 121,377,840 | RUB 11,108,393 | 12.4% | RUB 666 |
| By branch | Leads | Customers with a booking | Customers with a meeting | Buyers | Revenue | Acquisition spend | Lead-to-purchase rate | Blended CPL |
|---|---|---|---|---|---|---|---|---|
| Moscow | 3,542 | 2,118 | 1,586 | 501 | RUB 28,039,557 | RUB 2,347,070 | 14.1% | RUB 663 |
| Saint Petersburg | 4,093 | 2,400 | 1,633 | 512 | RUB 31,282,242 | RUB 2,744,462 | 12.5% | RUB 671 |
| Yekaterinburg | 4,382 | 2,567 | 1,327 | 410 | RUB 21,620,944 | RUB 2,919,318 | 9.4% | RUB 666 |
| Novosibirsk | 2,793 | 1,631 | 1,247 | 384 | RUB 24,214,343 | RUB 1,858,526 | 13.7% | RUB 665 |
| Vladivostok | 1,863 | 1,090 | 836 | 258 | RUB 16,220,754 | RUB 1,239,017 | 13.8% | RUB 665 |
| Total | 16,673 | 9,806 | 6,629 | 2,065 | RUB 121,377,840 | RUB 11,108,393 | 12.4% | RUB 666 |
| By campaign | Impressions | Clicks | Spend | Leads | CPC, RUB | CTR | CPL, RUB | Lead conversion |
|---|---|---|---|---|---|---|---|---|
| Brand campaign | 295,859 | 12,831 | RUB 1,043,660 | 540 | RUB 81 | 4.3% | RUB 1,933 | 4.2% |
| Yandex Advertising Network | 907,658 | 37,068 | RUB 2,191,681 | 1,626 | RUB 59 | 4.1% | RUB 1,348 | 4.4% |
| Retargeting | 239,527 | 10,004 | RUB 782,743 | 378 | RUB 78 | 4.2% | RUB 2,071 | 3.8% |
| Direct Search | 356,727 | 15,474 | RUB 1,200,208 | 638 | RUB 78 | 4.3% | RUB 1,881 | 4.1% |
| Total | 1,799,771 | 75,377 | RUB 5,218,292 | 3,182 | RUB 69 | 4.2% | RUB 1,640 | 4.2% |
| By branch | Impressions | Clicks | Spend | Leads | CPC, RUB | CTR | CPL, RUB | Lead conversion |
|---|---|---|---|---|---|---|---|---|
| Moscow | 396,529 | 16,571 | RUB 1,107,539 | 670 | RUB 67 | 4.2% | RUB 1,653 | 4% |
| Saint Petersburg | 451,038 | 18,731 | RUB 1,312,294 | 795 | RUB 70 | 4.2% | RUB 1,651 | 4.2% |
| Yekaterinburg | 452,133 | 18,883 | RUB 1,348,014 | 830 | RUB 71 | 4.2% | RUB 1,624 | 4.4% |
| Novosibirsk | 291,951 | 12,368 | RUB 870,267 | 532 | RUB 70 | 4.2% | RUB 1,636 | 4.3% |
| Vladivostok | 208,120 | 8,824 | RUB 580,178 | 355 | RUB 66 | 4.2% | RUB 1,634 | 4% |
| Total | 1,799,771 | 75,377 | RUB 5,218,292 | 3,182 | RUB 69 | 4.2% | RUB 1,640 | 4.2% |
As of · Days remaining: 13
| By manager | Scheduled meetings | Completed meetings | Meetings with a sale | Scheduled → held | Held → sale | Scheduled → sale |
|---|---|---|---|---|---|---|
| Evgeny | 1,218 | 865 | 263 | 71% | 30.4% | 21.6% |
| Sergey | 1,274 | 903 | 270 | 70.9% | 29.9% | 21.2% |
| Tatiana | 1,391 | 894 | 269 | 64.3% | 30.1% | 19.3% |
| Victoria | 1,431 | 926 | 276 | 64.7% | 29.8% | 19.3% |
| Nadezhda | 1,474 | 723 | 214 | 49.1% | 29.6% | 14.5% |
| Viktor | 1,545 | 752 | 219 | 48.7% | 29.1% | 14.2% |
| Alexander | 1,916 | 1,388 | 407 | 72.4% | 29.3% | 21.2% |
| Ksenia | 1,275 | 927 | 269 | 72.7% | 29% | 21.1% |
| Total | 11,524 | 7,378 | 2,187 | 64% | 29.6% | 19% |
| By branch | Scheduled meetings | Completed meetings | Meetings with a sale | Scheduled → held | Held → sale | Scheduled → sale |
|---|---|---|---|---|---|---|
| Moscow | 2,492 | 1,768 | 533 | 70.9% | 30.1% | 21.4% |
| Saint Petersburg | 2,822 | 1,820 | 545 | 64.5% | 29.9% | 19.3% |
| Yekaterinburg | 3,019 | 1,475 | 433 | 48.9% | 29.4% | 14.3% |
| Novosibirsk | 1,916 | 1,388 | 407 | 72.4% | 29.3% | 21.2% |
| Vladivostok | 1,275 | 927 | 269 | 72.7% | 29% | 21.1% |
| Total | 11,524 | 7,378 | 2,187 | 64% | 29.6% | 19% |
| Months | Value |
|---|---|
| April 2026 | RUB 678 |
| May 2026 | RUB 553 |
| June 2026 | RUB 804 |
Core employment, project roles and experience in marketing.
Some periods overlap because projects ran in parallel.
Healthcare services network
A corporate BI environment connecting source systems and a data warehouse to marketing, sales and customer funnel reporting.
Customer analytics project
Customer segmentation, repeat purchases and marketing channel performance.
Transport and logistics company
Orders, marketing and operational performance: delivery times, vehicle utilisation and demand patterns.
Medical centre
The patient journey from initial enquiry to booking and visit, with reporting for management and customer service.
Packaging and consumables company
Advertising campaigns, analytical dashboards and automation of recurring marketing tasks.
Digital agency
Hands-on advertising experience provided business context for my subsequent move into data analytics.
Own business analytics and automation project
Additional experience in gathering requirements and designing analytical solutions.
I want to join a team at a company with well-established processes, contribute to shared goals, exchange knowledge with colleagues and grow as an analyst.
I organise my own work: setting priorities, planning tasks and following them through to completion.
I learn quickly and am ready to invest time in new tools and approaches. I enjoy analytics: finding connections in data, understanding why metrics change and answering business questions.
Professional development
SQL, Python, data visualisation, statistics and marketing analytics.
SQL Academy
Yandex Practicum
Yandex Practicum
karpov.courses
Yandex Practicum
Skillfactory
stepik.org
stepik.org
I am considering in-house Data Analyst and BI Analyst roles. Contact me about an open position or to request my CV.
Moscow · On-site, hybrid or remote
 Decibel